
Visual dashboard software has become a critical tool for organizations that want to track performance, analyze trends, and share insights across teams. The right dashboard makes it easy to see data in real time, spot problems early, and make informed decisions. With so many options on the market, it can be challenging to choose the best fit. This guide compares the top five visual dashboard programs side by side so you can see their strengths, weaknesses, and unique features at a glance.
Why Business Intelligence (BI) Dashboards Matter
A visual dashboard takes raw data from multiple sources and presents it in charts, graphs, and other visual elements that are easier to understand. As outlined in our business intelligence dashboard comparison, these tools allow leaders to move quickly from analysis to action. Businesses rely on dashboards to:
- Monitor KPIs and performance metrics
- Spot patterns or anomalies in data
- Share consistent reports with stakeholders
- Support data-driven decision-making
How We Selected the Top 5
We focused on platforms that are widely used, respected for their capabilities, and flexible enough to serve a range of industries when determining which to feature in our business intelligence dashboard comparison. The five tools in this comparison are:
- Microsoft Power BI
- Tableau
- Domo
- Looker Studio
- Qlik Sense
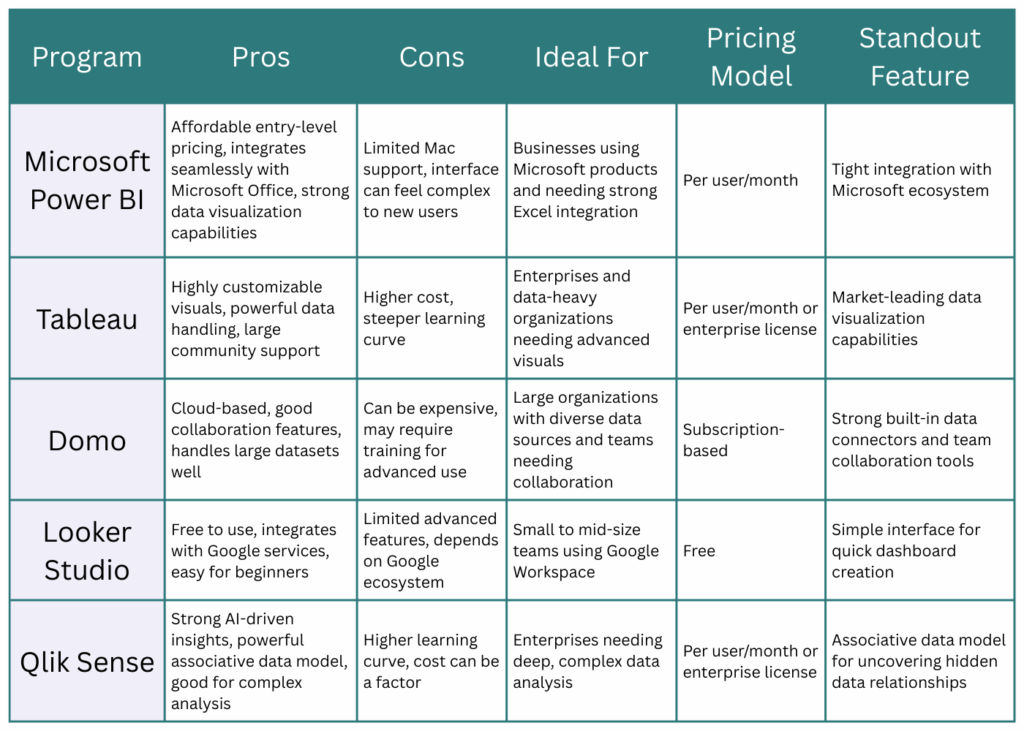
Business Intelligence Dashboard Comparison: Pros and Cons
Key Considerations Before Choosing
After reviewing the business intelligence dashboard comparison in the graphic above, it’s important to think about factors such as:
- Your budget and how licensing works
- Compatibility with your current technology stack
- The size and skill level of your team
- The data sources you need to integrate
- Whether you need advanced analytics or simple reporting
Finding the Right BI Dashboard for Your Needs
Each of these tools offers valuable features, but the right choice depends on your business goals, budget, and technical requirements. The table above can help narrow your options by showing where each program shines and where it might fall short. Meredith Vantage can provide expert guidance to help you choose, implement, and maximize the value of your visual dashboard software. Contact us today to discuss the best fit for your organization.